The goal of this blog post is to arrange a irregularly (with varying time intervals) spaced raster stack from Landsat into a regular time series to be used in the Breaks For Additive Season and Trend (bfast
) package and function.
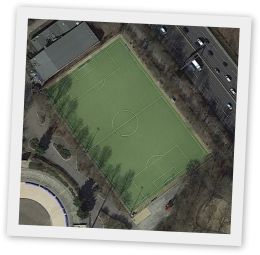
Berlin has 450 soccer fields across the city. I downloaded their spatial data from Open Street Map, added temporal information from recorded satellite images, recognised the pitch surfaces and analyzed their recent changes.
The blog post shows how the vegetation of two public parks changes seasonally. Multi-temporal satellite images were used to aggregate monthly histograms of vegetation index values.
Google Earth Engine provides with the ‘Profiler’ cloud-computing performance information concerning the resources consumed during script computation.
The analysis of satellite images from Sentinel-2 shows how green Europe’s capitals really are. The greenness was evaluated with the Normalized Difference Vegetation Index and allows comparison among the 43 analyzed capitals.
Welcome, to my first step by step tutorial to investigate Landsat image availability and metadata properties for every country within the Earth Engine.
Hi, my name is Philipp and you are reading the first post on my new blog. I am a earth observation enthusiast and remote sensing nerd, based in Berlin.