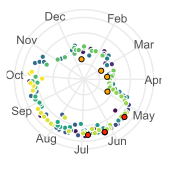
Analysis of all available Earth Engine App source codes and aggregated information on what data and modules creators load and which areas they are interested in.

All (1395!!) publically available Google Earth Engine Apps, ordered alphabetically by users name.

Read a short summary about my blog in 2020 (including Google Analytics summary).

A small anecdote I recall, while reading about All the power of <- fill-software-name-here -> without the coding and it goes like this …

This blogpost is about RStudio and the
reticulate package! Reticulate includes a Python engine for R Markdown that enables easy interoperability between Python and R chunks. This enables us to bring the power of Earth Engine to RStudio.

In Google Earth Engine we usually load an image collection first and then filter it by a date range, a region of interest and a image property with some cloud percentage estimates.
If the cloud threshold value is set too low it may happen that we throw away (filter out) to many images that could have been useful for our analysis. If we select the filter too generously, too many scenes with clouds remain. Finding a good threshold is not easy, this blog post may help to find it.

A Google Earth Engine App (prototype) to compare European countries NO2 Median changes during the Corona lockdown with the previous year.

