In Google Earth Engine we usually load an image collection first and then filter it by a date range, a region of interest and a image property with some cloud percentage estimates.
If the cloud threshold value is set too low it may happen that we throw away (filter out) to many images that could have been useful for our analysis. If we select the filter too generously, too many scenes with clouds remain. Finding a good threshold is not easy, this blog post may help to find it.
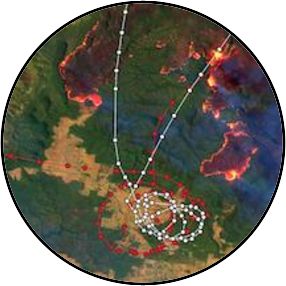
Every painting has its story. The same is true for satellite images. This blogpost is about a Sentinel-2 satellite image of the Australian bush fire and how a second data source helped to visualize fire-fighting missions.
I wrote a little Earth Engine App where I compared the data availability of Sentinel-1C (Top of Atmosphere) and Sentinel-2A (Surface Reflectance) within the EE data catalog. This blogpost is about the code behind the App.
Since the 27th of March 2019 has the Earth Engine data catalogue one more dataset. Sentinel-2 Surface Reflectance (Level-2A) data are finally available. This blog post teaches you in one minute, how to get the current Sentinel-2 ingestion status for your country.
How often does Landsat-8 and Sentinel-2 appear at the same location at the same time?! Do both satellites really fly over the same spot somewhere at the same time, sometime? If so, Sentinel-2 should incidentally take photos of the Landsat-8 satellite itself. Well, let the quest for an unlikely image begin.
The analysis of satellite images from Sentinel-2 shows how green Europe’s capitals really are. The greenness was evaluated with the Normalized Difference Vegetation Index and allows comparison among the 43 analyzed capitals.