
TL;DR Europe’s air pollution decreases at weekends and rises again during the working week. The Netherlands is the country with the highest proportion of Nitrogen Dioxide (NO2) in the air - during working days. A Car-Free-Day Saturday in Spain and Portugal did not show a significant improvement in NO2 values compared to other “normal” Saturdays.
Nitrogen dioxide (NO2)
Nitrogen dioxide is the chemical compound with the formula NO2. The most prominent human-caused source of NO2 are engines burning fossil. Outdoors, NO2 can be a result of traffic from motor vehicles (NO2- wikipedia).
For this blogpost, I used data from Sentinel-5 Precursor (S5P), a satellite capable to
monitor air pollution. The onboard sensor records Nitrogen Dioxide values in mol/m2 and provides the data for theDataset availability of Sentinel-5P in EarthEngine is from 2018-06-28 until Present.
- a) tropospheric vertical column
- b) stratospheric vertical column, or
- c) the total vertical column of NO2.
I used the data from the tropospheric vertical column. The troposphere is the lowest layer of the Earth’s atmosphere, where nearly all weather conditions take place.
Weekend vs. Weekday separation
I used the Google Earth Engine to get my hand on the Sentinel-5P archive. These were my working steps:
- Remove pixels with more than 20 % cloud fraction.
- Devide the daily data into
- weekdays (Monday - Friday) and
- weekends (Saturday - Sunday).
- weekdays (Monday - Friday) and
- Calculate the median value for each pixel.
- Export the data for each European country.
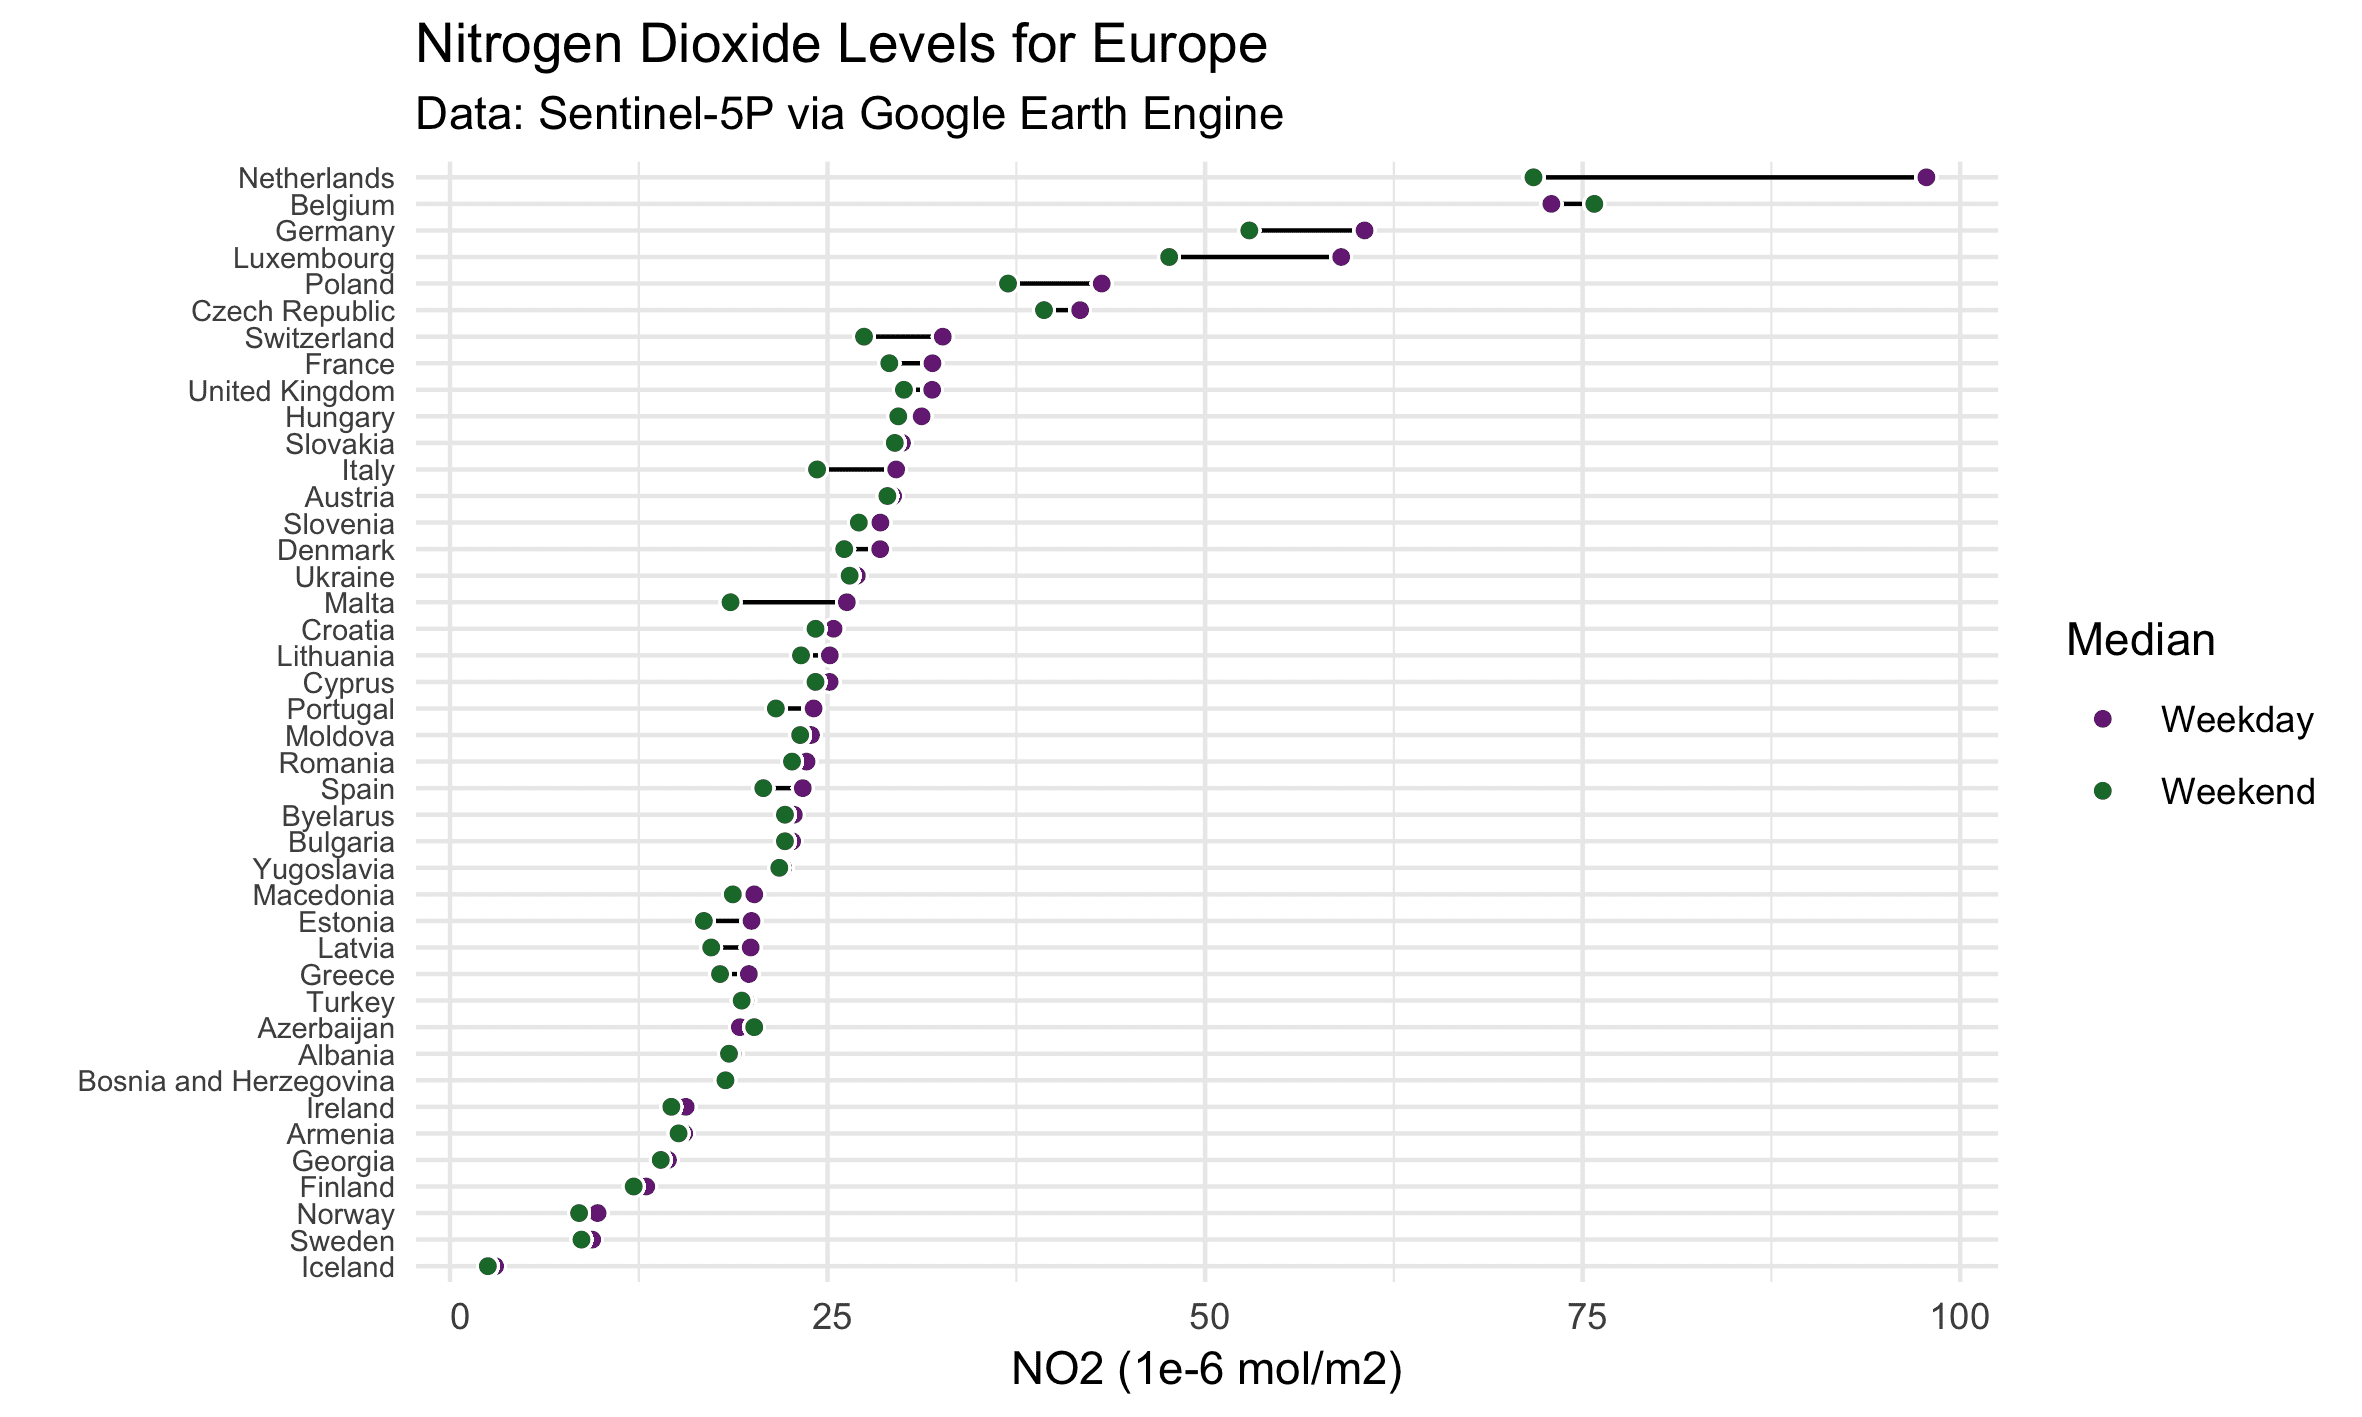 Figure: Within Europe is Netherlands the country with the highest proportion of Nitrogen Dioxide (NO2) in the air - during working days.
Why is there a difference between weekend / weekdays NO2 values?
At this point I can only make assumptions. The reactors, kilns and power plants run around 24⁄7 non-stop. Thats for sure. There won’t be any great variation between days. However, on weekends there are many closed shops, fewer people work and there are fewer commuters, less traffic, fewer cars on the roads and therefore less car emissions, and therefore less NO2 in the troposphere.
What surprises me, is the fact that Belgium has lower NO2 values during the week than at the weekend. However, Belgium is also an exception.
Car-Free Day 2018
The Car-Free Day encourages motorists to give up their cars for a day. Organized events are
held in some cities and countries. In 2018, the Car-Free-Day took place on September, 22 2018 (a Saturday). Well, does Sentinel recognize if there are fewer cars driving (less car emission)?Does Sentinel-5P recognize if there are fewer cars driving? Here's my trial.
Did Sentinel-5P record images on the 22. September 2018 over Europe?
Yes, of course. BUT, there are many clouds over central and northern Europe (masked out in the image below). However, there are mostly good conditions in Portugal and Spain (as always).
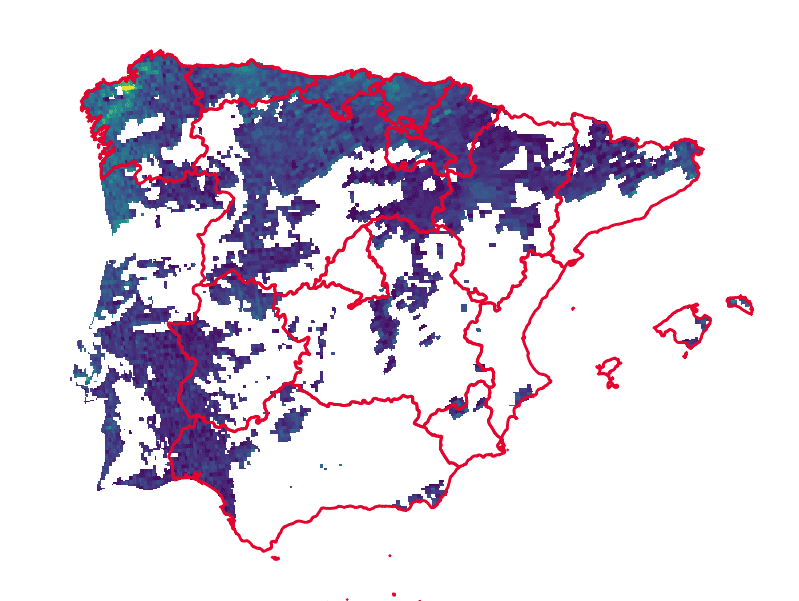
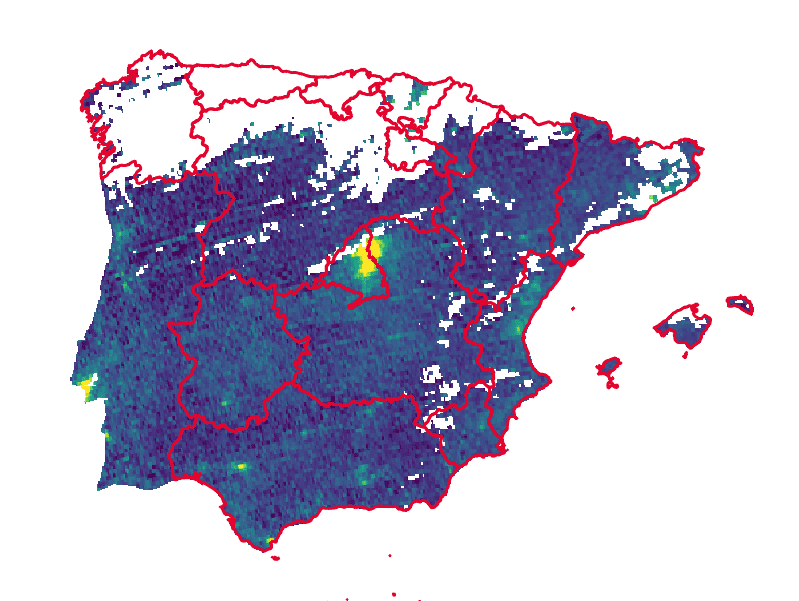
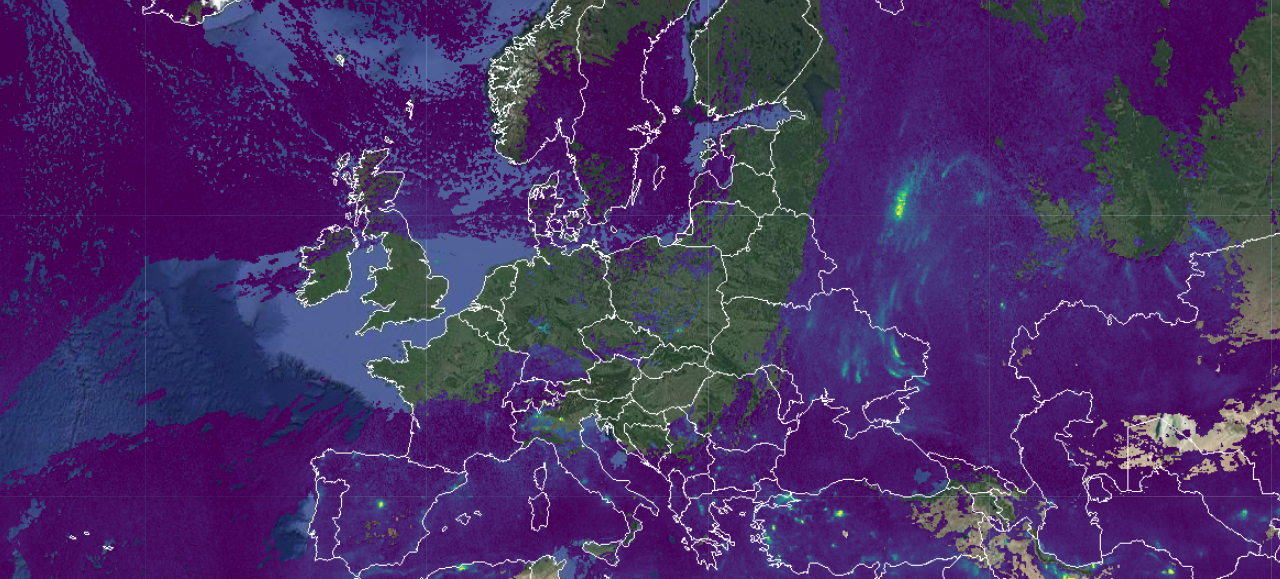 Sentinel-5P Nitrogen Dioxide median values recorded on the Saturday the 22. September 2018 (pixels with a cloud fraction above 20% were removed).
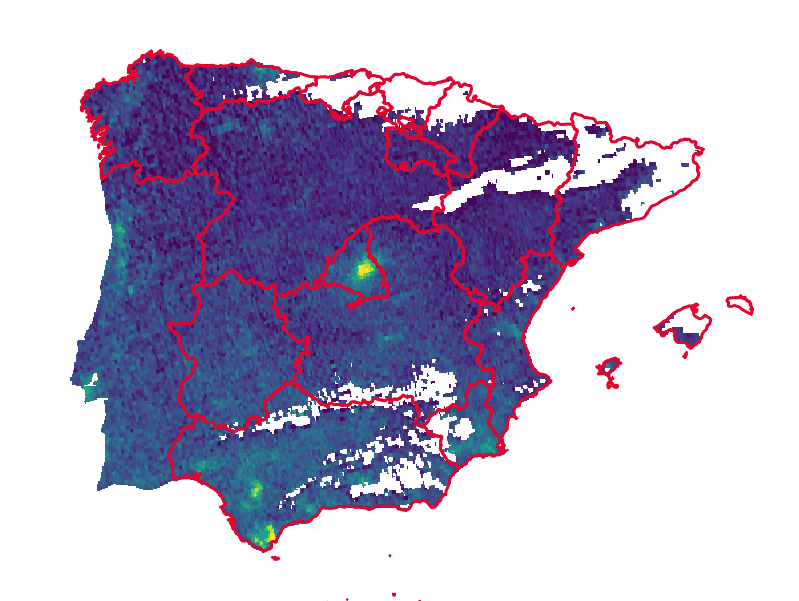
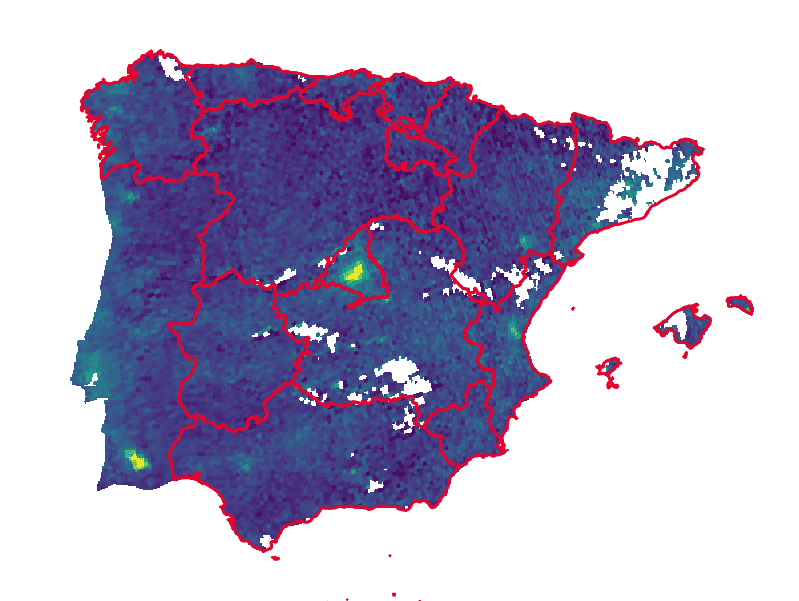
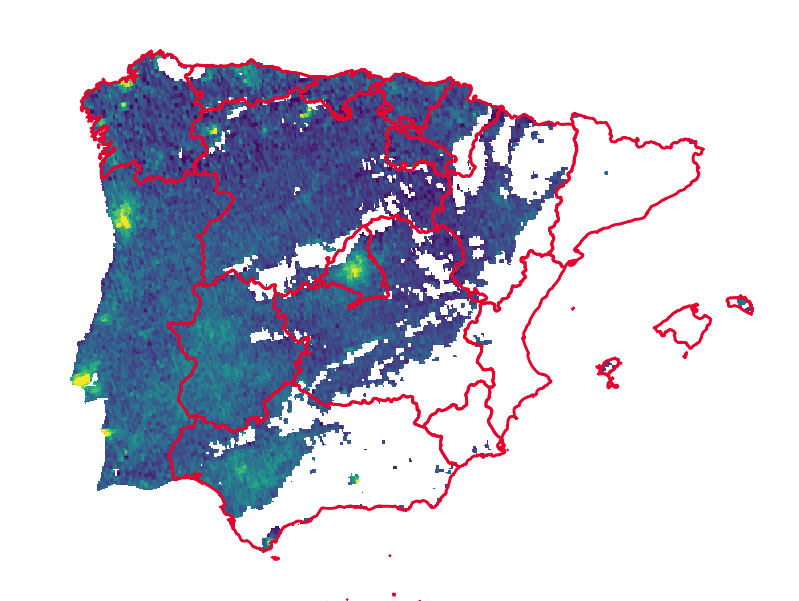
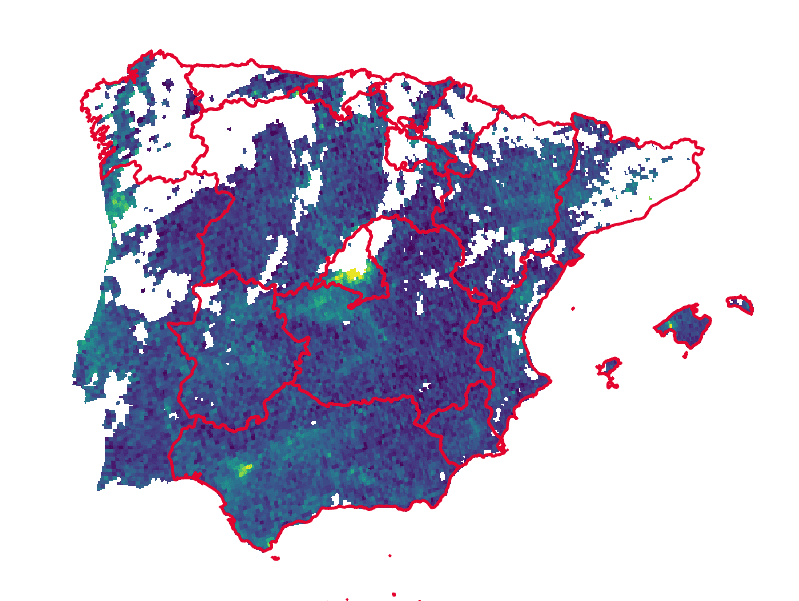
Challenge: Compare Nitrogen Dioxide values for several Saturdays over Portugal and Spain
What do you think, will there be any difference in Nitrogen Dioxide values between the Car-Free-Day (a Saturday) and any other normal average Saturday?
 25. August 2018
 1. September 2018
 8. September 2018
 15. September 2018
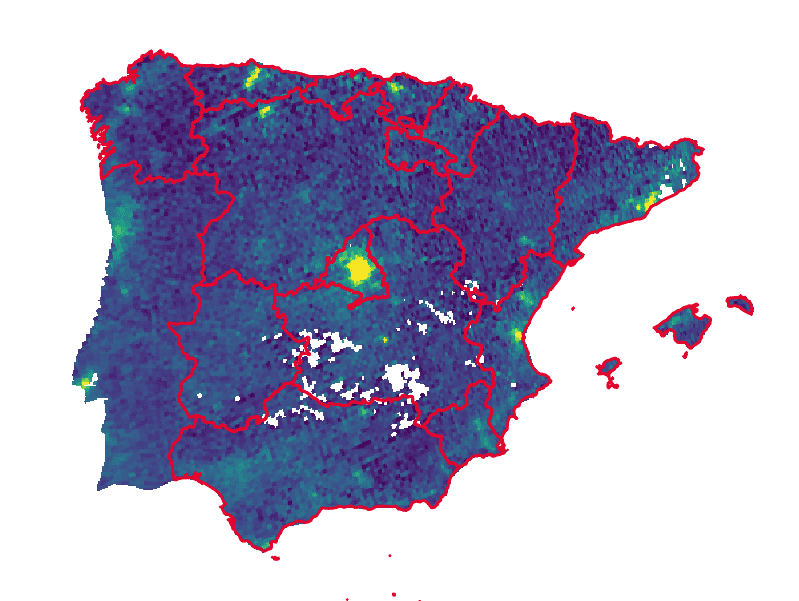 22. September 2018 our only Car-Free-Day
 29. September 2018
 6. October 2018
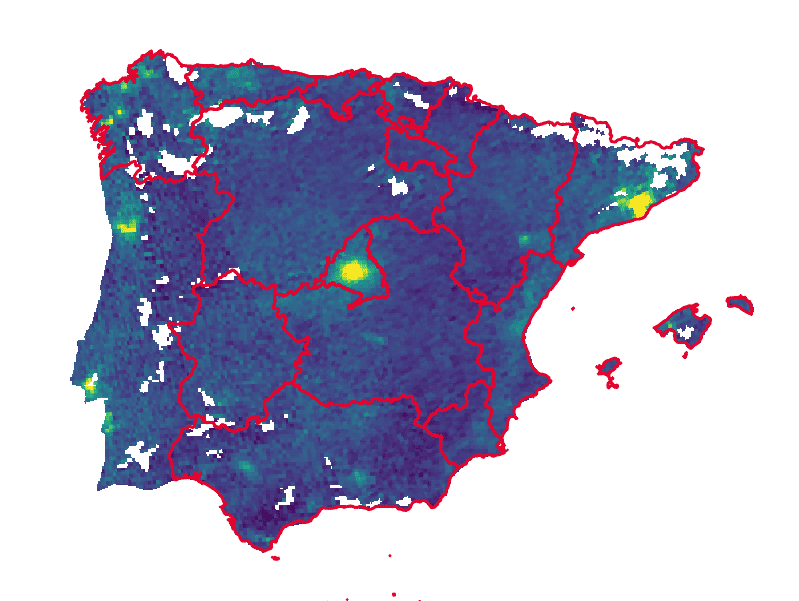
 13. October 2018
Car-Free-Day has the same NO2 values like normal Saturday
The Car-Free-Day, which happened to be on the 22. September, shows in the Sentinel-5P data the same NO2 values like other “normal” Saturdays.
In the lower graph is the Car-Free-Day histogram highlighted and the corresponding median values are marked as black dots.
 Sentinel-5P data for the Car-Free-Day show similar NO2 values like on any other ordinary Saturday.
Bottom Line
Sentinel5 is a great sensor that helps us make air pollution visible. In the short blog entry I have shown that the air pollution on weekends is lower than within the week.
The example of the Car-Free-Day 2018 in Spain and Portugal did not show a significant improvement in NO2 values compared to other normal Saturdays before and after.
You can cite this blogpost using: Gärtner, Philipp (2018/12/19) “Europe’s air pollution is lower during weekends”, https://philippgaertner.github.io/2018/12/no2/
If you have any questions, suggestions or spotted a mistake, please use the comment function at the bottom of this page.
Previous blog posts are available within the blog archive. Feel free to connect or follow me on Twitter - @Mixed_Pixels.