Analysing Google Earth Engine User Summit 2018 tweets
Today ended the three-day Google Earth Engine User Summit 2018. On social media channels such as Twitter and YouTube, could non-participants indirectly follow the progress and news around the Earth Engine technology. I think @eMapR_Lab describes the situation quite well.
@katefickas Thanks for sharing highlights from #eeus18! Your posts are a great resource for us that can't be there. 😀
— Justin Braaten (@jstnbraaten) June 13, 2018
This blogpost serves as a small personal summary of what I have heard from Dublin in the last three days.
With the help of the rtweet package I downloaded all tweet information with the hashtag #eeus19 and #EEUS18. I analysed the data mainly with the R packages dplyr, tidytext and created plot with ggplot.
Twitter Activity Timeline
Here I show the Twitter activity timeline, which also included the days before the summit. However, the highest Twitter activity was during the days of the Summit from June 12 until June 14. The time of the Twitter data download was at 2018-06-14 17:51:40.

Top Contributors - Original Tweets
I have labelled the following particularly active twitter users (5 or more original tweets) as top contributors.


Tweet Engagement
Engagement rate is the total number of times a user has interacted with a Tweet. This includes all clicks anywhere on the Tweet (including hashtags, links, avatar, username, and Tweet expansion), retweets, replies, follows, and likes (Info: Twitter). Here I considered only retweets and likes as engagement.


Add Score Metric
Dean Attali introduced in his blogpost a simple score metric for how successful a tweet is, using the very little bit of information we have. This is of course very arbitrary. He chose to score a tweet’s success as a linear combination of its “# likes” and “# retweets”. Tweets during the Google Earth Engine User Summit 2018 had roughly four times as many likes as retweets, therefore retweets get four times the weight. By means of the scorer points we find the top 10 tweets with the greatest engagement.
Top 10 - Score Tweets
Satellites, data science — hear about these topics and more from @esa and @usgs live from #eeus18 June 12 in Dublin. Set a reminder: https://t.co/3WCKW73qjt | Learn more: https://t.co/xfIJZWSvRV pic.twitter.com/VZBJjdQCYr
— Google Earth (@googleearth) June 9, 2018
#Today we are in Dublin for the @googleearth User Summit #eeus18! @esa #Sentinel1 Mission Manager Pierre Potin will talk live, tune in after lunch here: https://t.co/o9yu7P5C26 pic.twitter.com/d2JmTy2NJ5
— ESA EarthObservation (@ESA_EO) June 12, 2018
With a fleet of 7 @CopernicusEU #EO satellites in orbit we can take care of our planet with the help of comprehensive, up to date, global open access data - #Sentinel1 Mission manager Pierre Potin talking live at @googleearth #eeus18: https://t.co/o9yu7P5C26 pic.twitter.com/hhCxUUUTt1
— ESA EarthObservation (@ESA_EO) June 12, 2018
So excited to head to #Dublin for the @googleearth #GoogleEarthEngine users summit! I’ll give a lightning talk on my (nearly) finished PhD work & how we can use GEE & @NASA_Landsat spectral-temporal features to map and monitor #wetlands! #eeus18 #LadiesofLandsat #WomenInSTEM pic.twitter.com/NxDZRn9M82
— Dr. Kate Fickas (@katefickas) June 9, 2018
Pre-2008, Landsat wasn't free. It would have cost $400 million dollars to buy the Landsat scenes for the Hansen et al. 2013 forest cover study! Impossible. Kudos to NASA/USGS for their foresight 👊 #EEUS18 pic.twitter.com/WdGGFw76t8
— Ollie Wearn (@olliewearn) June 12, 2018
The biggest #LadiesofLandsat gathering we’ve ever had! Thank you to all the powerful women #GalsofGEE who joined the group at @googleearth #eeus18 and thank you to @google for a killer focus on diversity during the summit #STEMinism #GlobalDomination 🌎🌍🌏 pic.twitter.com/ighxJiKu5V
— Ladies of Landsat (@LadiesOfLandsat) June 14, 2018
Looking forward to opening our annual Google Earth Engine User Summit in 3 days, this year in Dublin Ireland! Join us by livestream: https://t.co/7sFKm98hs5 #eeus18 https://t.co/bBxQVT3JJ5 pic.twitter.com/Cnv1yQPjNb
— Rebecca Moore (@rebeccatmoore) June 8, 2018
"For the first time at one of these kind of conferences there was a line at the women's restroom." - software engineer on the growth of women in the industry #EEUS18 pic.twitter.com/eBWRjMbPXM
— Google Earth (@googleearth) June 13, 2018
Visualizing the journeys of #EEUS18 participants to Dublin, using @Google #EarthEngine (thanks to EE developer Eduardo Poyart who created this animation last night!) 135 lines of Earth Engine code. pic.twitter.com/eIlycv4m3y
— Rebecca Moore (@rebeccatmoore) June 12, 2018
The team is excited to be in Dublin this week for #EEUS18! If you're joining us or planning a trip soon, let our Dublin itinerary be your guide: https://t.co/4LPbQDvghH pic.twitter.com/um10vCpA59
— Google Earth (@googleearth) June 11, 2018
Count of unique word found in tweets
So what do the conference participants actually tweet about? Here I use the R code from Lesson 3. Text Mining Twitter Data With TidyText in R from www.earthdatascience.org and count unique words found in tweets. I exclude obvious buzzwords like eeus18, earth, engine, googleearth, summit, google, earthengine, googleearthengine, 2018, but also words like https, t.co.

Sentiment Analysis of Google Earth Engine User Summit 2018 Tweets
Sentiment analysis classifies words as positive or negative. Here I use the ‘bing’ sentiment data explained in Lesson 6 from https://www.earthdatascience.org and plot top words, grouped by positive vs. negative sentiment.
The mentioned negative sentiments refer to illegal logging and cloud detection and removal in satellite imagery. These tasks are hard and complex. However, its seem that everybody is super happy & excited to be in Dublin at the Summit.

Given the three day summit tweet time information, I plot the data over time to see how sentiment changed over time.


Wordclouds of Twitter hashtags used during the summit
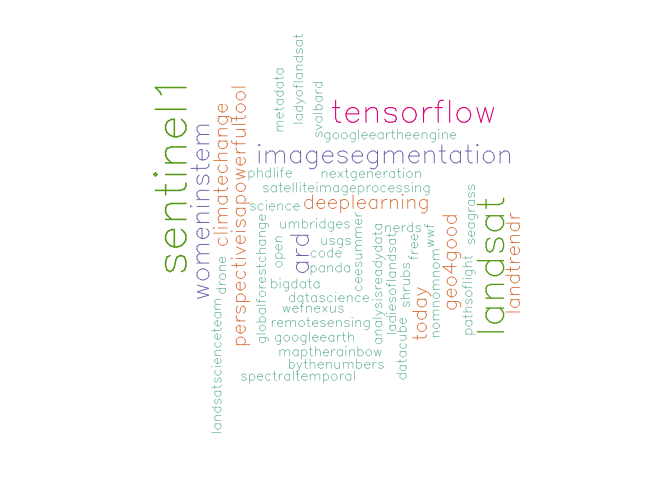 Hashtags used during the Google Earth Engine User Summit - Day 1: 2018-06-12
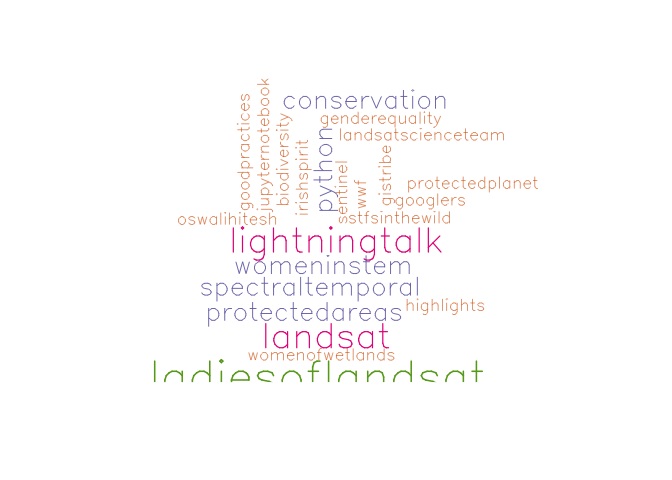 Hashtags used during the Google Earth Engine User Summit - Day 2: 2018-06-13
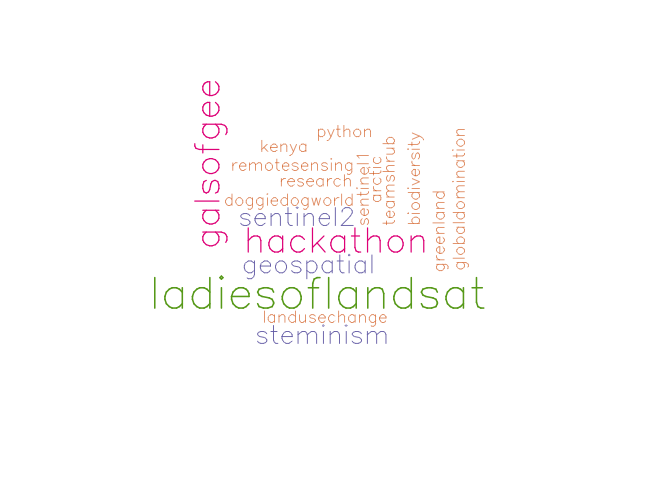 Hashtags used during the Google Earth Engine User Summit - Day 3: 2018-06-14
Bottom line
This blog post is a summary of the Google Earth Engine User Summit 201 tweets from Dublin, Ireland. If you have any questions, suggestions or spotted a mistake, please use the comment function at the bottom of this page.
Previous blog posts are available within the blog archive. Feel free to connect or follow me on Twitter - @Mixed_Pixels.